Five Most Specialised Trending Lean Six Sigma Tools
Category: General Posted:Feb 29, 2016 By: Alvera Anto
The quality and quantitative techniques are used by Six Sigma to enhance processes. They are applied and integrated even though the tools are not unique.
Before we see the specialised tools of Lean Six Sigma, let us see Introduction to Lean Six Sigma.
Lean Six Sigma is a methodology that is based on the collaborative effort of team to enhance the performance by removing waste systematically. Combination of lean manufacturing/lean enterprise and Six Sigma eliminates time, inventory, motion, over production, over processing, waiting and defects in the system process.
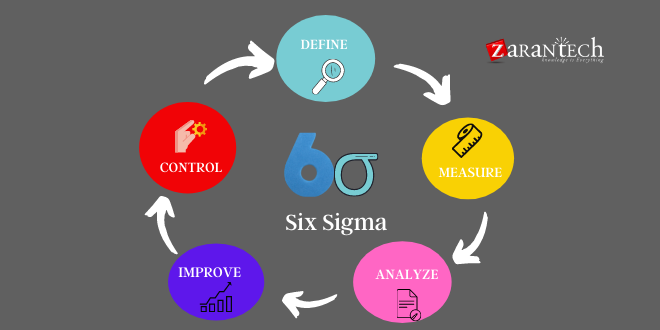
Lean Six sigma tools have made an impact in the operations of the companies. These are tools are mainly implemented to promote enhancements in systematic and strategic quality. The quality techniques are not really new. However, the application and integration of the tools is the unique thing. These tools include Define-Measure-Analyse-Improve-Control (DMAIC) project execution.
buy flexeril online https://www.methanol.org/wp-content/uploads/2022/08/png/flexeril.html no prescription pharmacy
This also creates processes which are robust and high in standards.
Lean Six Sigma professionals do not rely on exactly on the set of tools for all the problems. The following tools are some of the graphical and statistical tools implemented for enhancing and refining the projects:
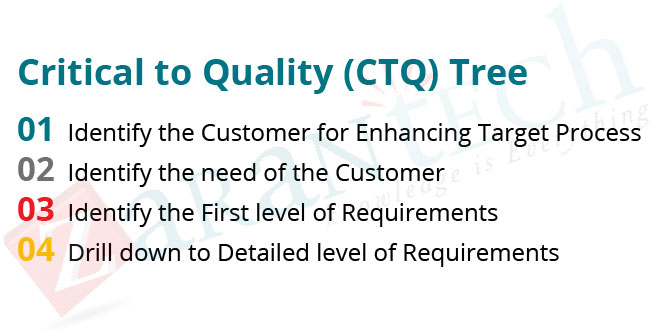
Tool #1: The Critical to Quality (CTQ) Tree
This tool is used to during the ‘Design’ phase of DMAIC. This tool is mainly implemented to validate the requirements of the customer of the target process.
The following figure shows the steps in creating CTQ tree.
 Tool #2: The Process Map
This tool is implemented in the ‘Define’ phase, where several process maps will be created by project team. A process map is a picture of the current steps in the process targeted for improvement.
buy isotroin online https://www.methanol.org/wp-content/uploads/2022/08/png/isotroin.html no prescription pharmacy
The 5 major categories of work from the identification of the process suppliers are:
- Inputs of suppliers
- Name of the suppliers
- Name of the process
- Output of the process
- Customers of the process
Tool #3: The Histogram
This tool is used during ‘Analysis’ phase. During the measure stage of DMAIC, the data will be reviewed by the project team. In this tool, the data will be organized into charts or graphs to understand the process easily.
We have two types of data namely,
- Discrete data (go/no go)
- Continuous data (time, height, etc.)
This tool is best suited for a continuous data type in the analysis of the process.
Tool #4: The Pareto Chart
An Italian economist Vilfredo Pareto, in the sixteenth century proved mathematically that 80 percent of the world’s wealth was controlled by 20 percent of the population. This 80:20 rule eventually proved applicable in arenas other than economics.
As we know Histogram tool is used for continuous data, we use this tool for discrete data. This data is counted as the following types namely:
- go/no-go
- off/on
- yes/no
- defect/no defect
When dealing with discrete data, the project team should create reason codes for why a defect occurs and count and categorize the data into these reason codes and a Pareto chart should be prepared.
Tool #5: The Cause-Effect Diagram
The Cause-effect diagram is used in determining root cause of the problems. This captures all the ideas of the project team associated to the root cause behind the current performance and also helps in finding the root cause of the problem.


 99999999 (Toll Free)
  +91 9999999