Data Science – Machine Learning Interview Questions
Category: Data Science Posted:Mar 28, 2019 By: Robert
Data Science is a broad topic that covers multiple disciplines; machine learning is one such field. Machine learning is very important for data science. It utilizes different techniques such as regression and supervised clustering. So, let’s discuss interview questions on Machine learning.
1. What are the main assumptions of linear regression? What are the most common types of linear regression? (Most formally put, what are the most common estimation techniques for linear regression).
Answer: A linear regression models the relationship between the dependent variable Y and the independent variable X.

Source: revisionmaths.com
So, here basically we are trying to use the features of X(independent variable) and then see if there’s a relationship between it with the dependent variable Y. So why is dependent on X. The two main assumptions are:
1. The relationship between the dependent variable Y and the explanatory variable X is linear to some degree.
2. The other main assumption is that the residual errors from the regression are normally distributed. (The residual error is the difference between the y value your regression line is predicting versus the true y value for whatever the explanatory variable value X was).
For the second part of the question, the most common types of linear regression are:
- Ordinary Least Squares
- Generalized Least Squares
- Penalized Least Squares
- L1 (LASSO i.e. Least Absolute Shrinkage and Selection Operator )
- L2 (Ridge)
Want to know more about Data Science? Click here
2. Describe the formula for logistic regression and how the algorithm is used for binary classification?
Answer: So, the formula for Logistic Regression:

Where e is the base of the natural logarithm (about 2.718) and beta o and beta 1 are the parameters of the model
We can then use the result of f(x) as the probability of the data point being in a positive class. So here we can actually compare. Right on top of each other what the linear model is doing versus what the logistic model is doing. The Linear Model S is the straight blue line. That can continue all the way for however many variables you have. You take that and you plug it into the logistic function giving you the logistic model and know the sigmoid shape of that logistic model. In the logistic function, the values are always going to be between 0 and 1. It allows us to actually calculate a probability of either be in class 0 or class 1 because we’ll set the cut-off right in the middle there and that middle point is going to be 0.5. So we decide that whatever we plug into the logistic model if its output value is less than 0.5 and classify that as zero. And if its value is greater than or equal to 0.5 we classify that as Class 1.

Learn the five reasons to learn Data Analytics
3. How does a Decision Tree decide on its splits (what are the criteria for a split point)?
Answer: So in general a decision tree can use the information gain to decide on the splitting criteria. Let’s give a brief overview of how this works.
- The decision tree is built in a top-down fashion, but the question is how do you choose which attribute to split at each node?
- The answer is finding the feature that best splits the target class into the purest possible children nodes.
- So this measure of purity is called the information.
- It represents the expected amount of information that would be needed to specify whether a new instance should be classified 0 or 1, given the example that reached the node.
- Entropy on the other hand is a measure of impurity (the opposite). It is defined for a binary class with values a/b as:
- p(a) * log(p(a))- p(b) * log(p(b)). And if you plot this you get a curve that looks something like the below image.

- Now by comparing the entropy before and after the split, we obtain a measure of information gain, or how much information we gained by doing the split using that particular feature.
Information_Gain = Entropy_before- Entropy_after
where Entropy controls how a Decision Tree decides to split the data.
Let’s see what entropy means in layman terms, Entropy is nothing but the measure of disorder.
(You can think of it as a measure of purity as well. You’ll see. I like disorder because it sounds cooler.)
4. What advantages does a decision tree model have over other machine learning models?
Answer: Advantages of Decision Trees:
- It is very easy to interpret and understand.
- It works on both continuous and categorical features.
- No normalization or scaling necessary.
- A prediction algorithm runs very fast.
5. What is the difference between random forest algorithms versus boosting algorithms?
Answer: Boosting trees are:
- Reassign weights to samples based on the results of previous iterations of classifications.
- Harder to classify points get weighted more.
- It is an iterative algorithm where each execution is going to be based on the previous results.
Random Forest is:
- RF applies bootstrap aggregation to train many different trees.
- This creates an ensemble of different individual decision trees.
- In random forest algorithm instead of using information gain or gynie index for calculating the root What happens is the process of finding the root node and splitting the feature nodes will happen at random.
- Gini index is nothing but, say if we select two items from a population at random then they must be of same class and probability for this
- is 1 if the population is pure.
Click here to learn A Beginner’s Guide To Data Science
6. Given a data set of features X and labels Y, what assumptions are made when using Naïve Bayes methods?
Answer: The naive base algorithm assumes that the features of x are conditionally independent of each other for the given y.
Naive Bayes model is called ‘naive’ algorithms because they make an assumption that the predictor variables are independent of each other.
- The idea that each feature independent of the other may actually not always be true, but we assume it to be true to apply naive Bayes. This naive assumption that each features independent of every other feature in relation to Y is where the namesake comes from.
7. Describe how the support vector machine (SVM) algorithm works.
Answer: A support vector machine is attempting to find a hyperplane that separates classes by maximizing the margin basically trying to get as much space as we can between these two classes.

The filled-in points in this diagram are the support vectors against that decision hyperplane. So if we have a new point depending on where it lies on the hyperplane that’s where we’re going to classify it. Thus, you can see here if we have something with a low X1 value and a low X2 value that falls on the other side of that max margin. So that will be classified as a Red Square and vice versa something really high X1 value and a really high X to value is going to fall on the other side of the other margin. And then there will be classified as a blue circle. So the filled endpoints that rest against that margin called the support vector because it’s essentially supporting that margin. So here we show linear classification, but SVMs can perform nonlinear classification. SVMs can employ the kernel trick which can map linear non-separable inputs into a higher dimension where they become more easily separable.
8. What is overfitting and what causes it? In what ways can you attempt to avoid overfitting?
Answer: Overfitting is when the machine learning model does not generalize well to data it has not seen before such as test data. It overfits the training data and that’s usually indicating it has too much complexity in regards to the training data size. So, let me see some examples.

- We can see here under fitting we have a high error on not just training points, but also test points.
- A good fit is when you have low errors in both your training set and your test set.
- Overfitting happens when you have a very complex model and on your training set, it performs very well because basically, it ended up fitting perfectly to every single point in your training set.
Different ways to attempt to fix overfitting:
- Increase the training data size
- Regularization
- Early stopping
- K-Fold Cross-Validation
9. Describe the differences between accuracy, precision, and recall.
Answer: Let’s imagine the results of a model.
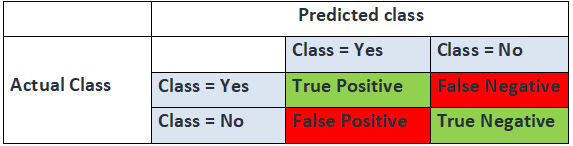
1. Accuracy is simply a ratio of correctly predicted observations to the total observations. Accuracy is a useful measure but only when you have symmetric data sets where values of false positive and false negative are almost the same. Therefore, we need to also consider Precision and Recall.
- Accuracy = (TP + TN) / (TP+FP+FN+TN)
2. Precision is the ratio of correctly predicted positive observations of the total predicted positive observations. The question that this metric answer is of all points that labeled as positive, how many were actually positive?
- Precision = TP / (TP +FP)
3. Recall (sensitivity) is the ratio of correctly predicted positive observations to all observations in the actual class.
- Recall = TP / (TP+FN)
10. What metrics can be used to evaluate a regression task?
Answer: Mean Absolute Error (MAE) is the mean of the absolute value of the errors represented by the given formula:

mean absolute error (MAE) is a measure of the difference between two continuous variables. It measures how far predicted values are away from observed values.
Mean Squared Error (MSE) is the mean of the squared errors represented by the given formula:

MSE can represent the difference between the actual observations and the observation values predicted by the model.
Root Mean Squared Error (RMSE) is the square root of the mean of the squared error:

So, these three are some of the most common metrics, root means square error probably being the most common because it takes advantage of the fact that you are punishing for larger errors. The other metrics to consider things are R-squared value and adjust that R-squared value.
11. What are the basic differences between Machine Learning and Deep Learning?

12. What is the difference between Bias and Variance?
Answer: Bias: Bias can be defined as a situation where an error has occurred due to the use of assumptions in the learning algorithm.
Variance: Variance is an error caused because of the complexity of the algorithm that is been used to analyze the data.
13. What is the difference between supervised and unsupervised machine learning?
Answer: Supervised learning is a process where it requires training labeled data. When it comes to Unsupervised learning it doesn’t require data labeling.
14. How is KNN different from k-means clustering?
Answer: KNN stands for K- Nearest Neighbours, it is classified as a supervised algorithm.
K-means is an unsupervised cluster algorithm.
15. How is kNN different from K-means clustering?
Answer: Don’t get mislead by ‘k’ in their names. You should know that the fundamental difference between both these algorithms is, k-means is unsupervised in nature, and kNN is supervised in nature. k-means is a clustering algorithm. kNN is a classification (or regression) algorithm.
k-means algorithm partitions a data set into clusters such that a cluster formed is homogeneous and the points in each cluster are close to each other. The algorithm tries to maintain enough separability between these clusters. Due to the unsupervised nature, the clusters have no labels.
kNN algorithm tries to classify an unlabeled observation based on its k (can be any number ) surrounding neighbors. It is also known as a lazy learner because it involves minimal training of the model. Hence, it doesn’t use training data to make generalizations on the unseen data sets.
16. I know that a linear regression model is generally evaluated using the Adjusted R² or F value. How would you evaluate a logistic regression model?
Answer: We can use the following methods:
1. Since logistic regression is used to predict probabilities, we can use the (AUC)-Receiver Operating Characteristic curve (ROC) curve along with the confusion matrix to determine its performance.
2. Also, the analogous metric of adjusted R² in logistic regression is the Akaike information criterion (AIC). AIC is the measure of fit which penalizes the model for the number of model coefficients. Therefore, we always prefer a model with a minimum AIC value.
3. Null Deviance indicates the response predicted by a model with nothing but an intercept. The lower the value, the better the model. Residual deviance indicates the response predicted by a model on adding independent variables. The lower the value, the better the model.
17. Considering the long list of the machine learning algorithm, given a data set, how do you decide which one to use?
Answer: You should say, the choice of machine learning algorithm solely depends on the type of data. If you are given a data set which is exhibits linearity, then linear regression would be the best algorithm to use. If you give to work on images, audios, then the neural network would help you to build a robust model.
If the data comprises of non linear interactions, then a boosting or bagging algorithm should be the choice. If the business requirement is to build a model that can be deployed, then we’ll use regression or a decision tree model (easy to interpret and explain) instead of black-box algorithms like support vector machines (SVM), Gradient Boosting Machine (GBM), etc.
In short, there is no one master algorithm for all situations. We must be scrupulous enough to understand which algorithm to use.
18. Do you suggest that treating a categorical variable as a continuous variable would result in a better predictive model?
Answer: For better predictions, the categorical variable can be considered as a continuous variable only when the variable is ordinal in nature.
19. When does regularization becomes necessary in Machine Learning?
Answer: Regularization becomes necessary when the model begins to overfit/underfit. This technique introduces a cost term for bringing in more features with the objective function. Hence, it tries to push.
20. OLS is to linear regression. The maximum likelihood is to logistic regression. Explain the statement.
Answer: OLS and Maximum likelihood are the methods used by the respective regression methods to approximate the unknown parameter (coefficient) value. In simple words, Ordinary least square (OLS) is a method used in linear regression that approximates the parameters resulting in minimum distance between actual and predicted values. Maximum Likelihood helps in choosing the values of parameters which maximizes the likelihood that the parameters are most likely to produce observed data.
21. What is the difference between Machine learning and Data Mining?
Answer: Data mining is about working on unstructured data and then extract it to a level where the interesting and unknown patterns are identified.
Machine learning is a process or a study whether it closely relates to the design, development of the algorithms that provide the ability to the machines to capacity to learn.
22. What is inductive machine learning?
Answer: Inductive machine learning is all about a process of learning by live examples.
23. State a few popular Machine Learning algorithms?
Answer:
- Nearest Neighbour
- Neural Networks
- Decision Trees etc
- Support vector machines
24. What are the different types of algorithm techniques are available in machine learning?
Answer: Some of them are:
- Supervised learning
- Unsupervised learning
- Semi-supervised learning
- Transduction
- Learning to learn
25. What are the three stages to build the model in machine learning?
Answer:
- Model building
- Model testing
- Applying the model
26. What is the standard approach to supervised learning?
Answer: The standard approach to supervised learning is to split the set of examples into the training set and the test.
27. What is ‘Training set’ and ‘Test set’?
Answer: In various areas of information science like machine learning, a set of data is used to discover the potentially predictive relationship known as ‘Training Set’. The training set is an example given to the learner, while the Test set is used to test the accuracy of the hypotheses generated by the learner, and it is the set of examples held back from the learner. The training set is distinct from the Test set.
28. Explain what is the function of ‘Unsupervised Learning’?
Answer:
- Find clusters of the data
- Find low-dimensional representations of the data
- Find interesting directions in data
- Interesting coordinates and correlations
- Find novel observations/ database cleaning
Learn Data Science from Industry Experts & Get Certified
29. Explain what is the function of ‘Supervised Learning’?
Answer:
- Classifications
- Speech recognition
- Regression
- Predict the time series
- Annotate strings
At ZaranTech, we offer both Instructor-led live online & Self-paced video training on Data Science and help with Data Science Certification. To learn more about our courses, feel free to visit our website.
In the end, as always, thanks for reading, and stay safe and sound!
Happy Learning
 99999999 (Toll Free)
  +91 9999999