Data Science – Working with Data Interview Questions
Category: Data Science Posted:Mar 28, 2019 By: Robert
1. What is wrong with this query?
SELECT Id, YEAR (TrialDate) AS TrialYear
FROM Payments
WHERE Trial Year<=2015;
Answer: If we are saying select ID which is a column, we are also griping the year from the trial date column saying as a Trial year. And this is where the mistake happens. Here, we are saying a trial a year is less than or equal to 2015. The trial year will be assigned as the end, so you won’t be able to use it as a filter on WHERE. Instead, you should use: WHERE YEAR (TrialDate)<=2015.
Want to know more about Data Science? Click here
2. What is wrong with this query?
SELECT Id, TrialDate
FROM Payments
GROUP BY Id;
Answer: So the question was wrong in this query we are selecting two columns Id and trialdate from the payments table and we’re seeing grouped by ID. Which is an actual issue. There is no aggregate function on the TrialDate column. There needs to be an aggregate function, otherwise, the column should also be in the GROUP BY statement.
And the other thing you’re actually going to be grouping by the date column instead of having it as another column because there aren’t a whole lot of ways where you can sort of aggregate data together especially if they’re individual time stamps.
Thus, you always need to either have an aggregate function on the columns you’re calling when you’re using a GROUP BY statement or the column itself that needs to be inside the GROUP BY statement.
3. What is wrong with this query?
SELECT UserId, AVG(Total) AS AvgOrderTotal
FROM Invoices
HAVING COUNT (OrderId)>=1
Answer: Here we are saying select user id average on the total column as average order total from invoices having account Order ID greater than or equal to one.
The problem is we have a select statement from statement having statement and we’re calling an average on the total. There is no group by statement. In other words, the SQL statement is missing.
4. Consider the two tables below:
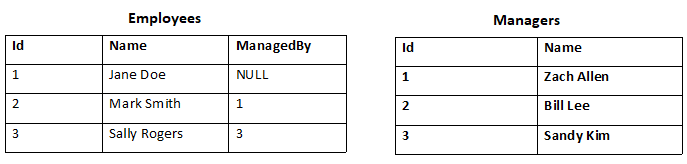
Write a query that retrieves all employees managed by Sandy Kim.
Answer: The query is:
SELECT Name FROM Employees
WHERE ManagedBy = 3
Typically, you’re not going to know because there’s going to be so many IDs and so many managers that you will have to join them. Thus the query is:
SELECT Employees.Name FROM Employees
JOIN Managers ON
Employees.ManagedBy = Managers.Id
WHERE Managers.Name LIKE “Sandy Kim”
5. Consider the same tables from question 4
Write a query that retrieves all employees that have no managers.
Answer: The query is
SELECT Name FROM Employees
WHERE ManagedBy Is Null
Checkout Our Article to Know More
6. What is the difference between Cluster and Systematic Sampling?
Answer: Cluster sampling is a technique used when it becomes difficult to study the target population spread across a wide area and simple random sampling cannot be applied. A cluster sample is a probability sample where each sampling unit is a collection or cluster of elements. Systematic sampling is a statistical technique where elements are selected from an ordered sampling frame. In systematic sampling, the list is progressed in a circular manner so once you reach the end of the list, it is progressed from the top again. The best example for systematic sampling is the equal probability method.
7. Mention what is data cleansing?
Answer: Data cleaning also referred to as data cleansing, deals with identifying and removing errors and inconsistencies from data in order to enhance the quality of data.
8. Why data cleaning plays a vital role in the analysis?
Answer: Cleaning data from multiple sources to transform it into a format that data analysts or data scientists can work with is a cumbersome process because – as the number of data sources increases, the time take to clean the data increases exponentially due to the number of sources and the volume of data generated in these sources. It might take up to 80% of the time for just cleaning data making it a critical part of the analysis task.
9. Which technique is used to predict categorical responses?
Answer: The classification technique is used widely in mining for classifying data sets.
10. Differentiate between univariate, bivariate, and multivariate analysis.
Answer: These are descriptive statistical analysis techniques that can be differentiated based on the number of variables involved at a given point in time. For example, the pie charts of sales based on territory involve only one variable and can be referred to as univariate analysis.
If the analysis attempts to understand the difference between 2 variables at the time as in a scatterplot, then it is referred to as bivariate analysis. For example, analyzing the volume of sales and spending can be considered as an example of bivariate analysis.
Analysis that deals with the study of more than two variables to understand the effect of variables on the responses is referred to as multivariate analysis.
11. Are expected value and mean value different?
Answer: They are not different but the terms are used in different contexts. Mean is generally referred to when talking about a probability distribution or sample population whereas expected value is generally referred to in a random variable context.
For Sampling Data
The mean value is the only value that comes from the sampling data.
Expected Value is the mean of all the means i.e. the value that is built from multiple samples. The expected value is the population means.
For Distributions
Mean value and Expected value are the same irrespective of the distribution, under the condition that the distribution is in the same population.
12. What is an Eigenvalue and Eigenvector?
Answer: Eigenvectors are used for understanding linear transformations. In data analysis, we usually calculate the eigenvectors for a correlation or covariance matrix. Eigenvectors are the directions along which a particular linear transformation acts by flipping, compressing or stretching. Eigenvalue can be referred to as the strength of the transformation in the direction of the eigenvector or the factor by which the compression occurs.
13. During analysis, how do you treat missing values?
Answer: The extent of the missing values is identified after identifying the variables with missing values. If any patterns are identified the analyst has to concentrate on them as it could lead to interesting and meaningful business insights. If there are no patterns identified, then the missing values can be substituted with mean or median values (imputation) or they can simply be ignored. There are various factors to be considered when answering this question-
- Understand the problem statement, understand the data and then give the answer. Assigning a default value which can be the mean, minimum, or maximum value. Getting into the data is important.
- If it is a categorical variable, the default value is assigned. The missing value is assigned a default value.
- If you have a distribution of data coming, for normal distribution give the mean value.
- Should we even treat missing values as another important point to consider? If 80% of the values for a variable are missing then you can answer that you would be dropping the variable instead of treating the missing values.
14. Difference between Validation Set and a Test Set?
Answer: A Validation set can be considered as a part of the training set because it is used for parameter selection and to avoid overfitting of the model being built. Whereas a test set is used for testing or evaluating the performance of a trained machine learning model.
15. What is cross-validation?
Answer: Cross-validation is a model validation technique for evaluating how the outcomes of statistical analysis will generalize to an independent dataset. Mainly used in backgrounds where the objective is forecast and one wants to estimate how accurately a model will accomplish in practice. The objective of cross-validation is to term a data set to test the model in the training phase (i.e. validation data set) in order to bound problems like overfitting and get an insight on how the model will generalize to an independent data set.
16. List out some of the best practices for data cleaning?
Answer: Some of the best practices for data cleaning includes:
- Sort data by different attributes
- For large datasets cleanse it stepwise and improve the data with each step until you achieve a good data quality
- For large datasets, break them into small data. Working with fewer data will increase your iteration speed
- To handle common cleansing tasks create a set of utility functions/tools/scripts. It might include, remapping values based on a CSV file or SQL database or, regex search-and-replace, blanking out all values that don’t match a regex
- If you have an issue with data cleanliness, arrange them by estimated frequency and attack the most common problems
- Analyze the summary statistics for each column ( standard deviation, mean, number of missing values,)
- Keep track of every date cleaning operation, so you can alter changes or remove operations if required
17. Mention what is the difference between data mining and data profiling?
Answer: The difference between data mining and data profiling is that
Data profiling: It targets the instance analysis of individual attributes. It gives information on various attributes like value range, discrete value, and their frequency, the occurrence of null values, data type, length, etc.
Data mining: It focuses on cluster analysis, detection of unusual records, dependencies, sequence discovery, relation holding between several attributes, etc.
18. Mention the name of the framework developed by Apache for processing large data set for an application in a distributed computing environment?
Answer: Hadoop and MapReduce is the programming framework developed by Apache for processing large data set for an application in a distributed computing environment.
19. Mention what are the data validation methods used by data analyst?
Answer: Usually, methods used by data analyst for data validation are
- Data screening
- Data verification.
Learn Data Science from Industry Experts
20. Explain what should be done with suspected or missing data?
Answer: Prepare a validation report that gives information on all suspected data. It should give information like validation criteria that it failed and the date and time of occurrence.
- Experience personnel should examine the suspicious data to determine their acceptability
- Invalid data should be assigned and replaced with a validation code.
- To work on missing data use the best analysis strategy like deletion method, single imputation methods, model-based methods, etc.
 99999999 (Toll Free)
  +91 9999999