A Beginner’s Guide To Data Science
Category: Data Science Posted:Jul 27, 2020 By: Ashley Morrison
As the world moved towards the era of big data, the need for its storage also grew. It was the main challenge and the problem concern for enterprises until 2010. The primary focus was on building a framework and storage to keep data. Currently, when Hadoop, and other frameworks, have successfully addressed the problem of storage, the focus has moved to the processing of this data. Data Science is the secret sauce here. All the ideas you see in Hollywood sci-fi movies can turn into a reality with Data Science. Data Science is the future of Artificial Intelligence. Therefore, it is very important to understand what is Data Science and how it can add value to your business.
In this article, I will be covering the following topics.
- What is Data Science in simple words?
- Why Data Science?
- Who is a Data Scientist?
- What does a Data Scientist do?
- What is the difference between Business Intelligence (BI) and Data Science?
- The lifecycle of Data Science with the help of a case study
By the end of this blog, you will be able to understand what is Data Science and its role in extracting significant insight from the complicated and large collections of data all over us.
What is Data Science in simple words?
Data Science is a blend of numerous tools, algorithms, and machine learning concepts to |
ding for years?
The solution lies in the distinction between describing and forecasting.
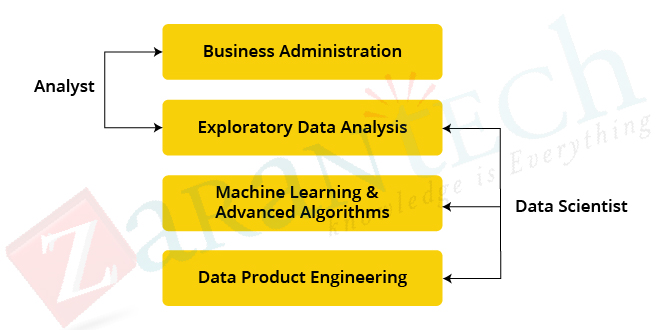
As you can see from the above image, a Data Analyst usually explains what is going on by refining the data history. On the other hand, Data Scientist not only does the exploratory evaluation to discover insights from data, but they also use numerous innovative machine learning algorithms to find out the occurrence of a specific occasion in the future. A Data Scientist will analyze the data from several angles, occasionally angles not known earlier.
So, Data Science is mainly used to make decisions and predictions utilizing predictive analytics, prescriptive analytics (predictive plus decision science), and machine learning.
Predictive Casual Analytics
If you want a design that can forecast the possibilities of a specific event in the future, you are required to use predictive causal analytics. Say, if you are providing cash on credit, then the probability of customers making future credit payments on time would be a concern for you. Here, you can build a model that can perform predictive analytics on the payment history of the consumer to forecast if the future payments will be on time or not.
Perspective Analytics
If you want a model that has the intelligence of taking its own choices and the ability to modify with dynamic specifications, you need perspective analytics for it. This fairly new field is all about providing advice. In other terms, it not only predicts but recommends a range of prescribed actions and associated results.
The most effective example of this is Google’s self-driving car. The data gathered by vehicles can be used to train self-driving cars. You can run algorithms on this data to bring intelligence to it. This will allow your vehicle to make choices like when to turn, which path to take, and when to slow down or speed up.
Machine Learning for making predictions– If you have transactional information of a finance firm and need to develop a model to figure out the future pattern, then machine learning algorithms are the best bet. This falls under the paradigm of supervised learning. It is called supervised learning because you already have the data based upon which you can train your machines. For instance, a fraud discovery model can be trained to use a historical document of deceptive acquisitions.
Machine Learning for pattern exploration– If you don’t have the parameters based on which you can make forecasts, then you require to discover hidden patterns within the dataset to make purposeful predictions. This is nothing but the not being watched design unsupervised models as you do not have any kind of predefined tags for grouping. The most usual algorithm for pattern discovery is Clustering.
Let’s say you are working in a Mobile Network Provider company and you are required to establish a network by putting towers in a region. Then, you can utilize the clustering strategy to find those tower locations which will guarantee that all the customers obtain optimal signal strength.
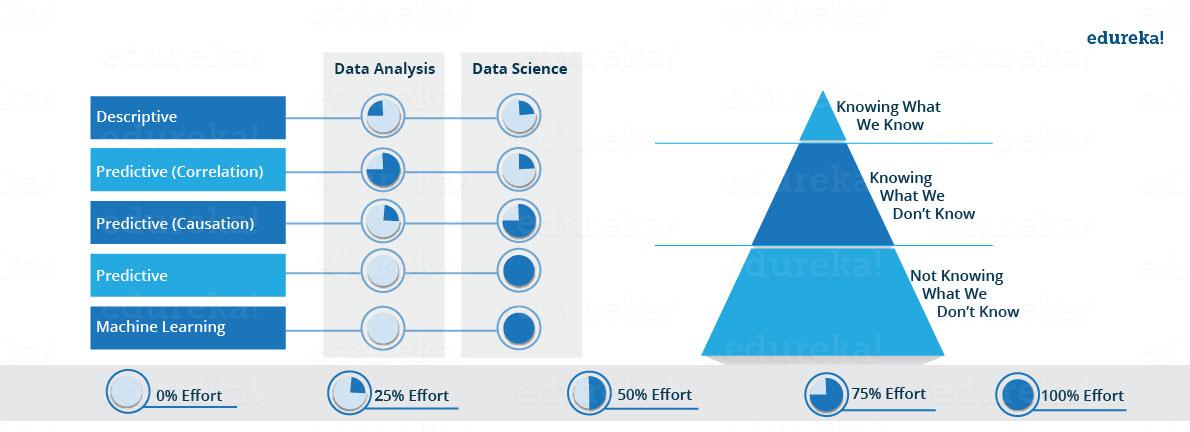
Now we’ll see exactly how the proportion of above-described methods differ for Data Analysts and Data Scientists. As you can see in the image below, Data Science includes descriptive analytics and forecast to a certain level. On the other hand, Data Science is more about Predictive Causal Analytics and Machine Learning.
Now that you understand what is Data Science, let’s find out why it is required in the first place.
Why Data Science?
Traditionally, the data that we had was mostly structured and little in size, which could be examined by using simple BI tools. Unlike data in the traditional systems which was mainly structured, today a lot of the data is unstructured or semi-structured. Let’s look at the data patterns in the image provided below which shows that by 2020, greater than 80% of the data will be disorganized.
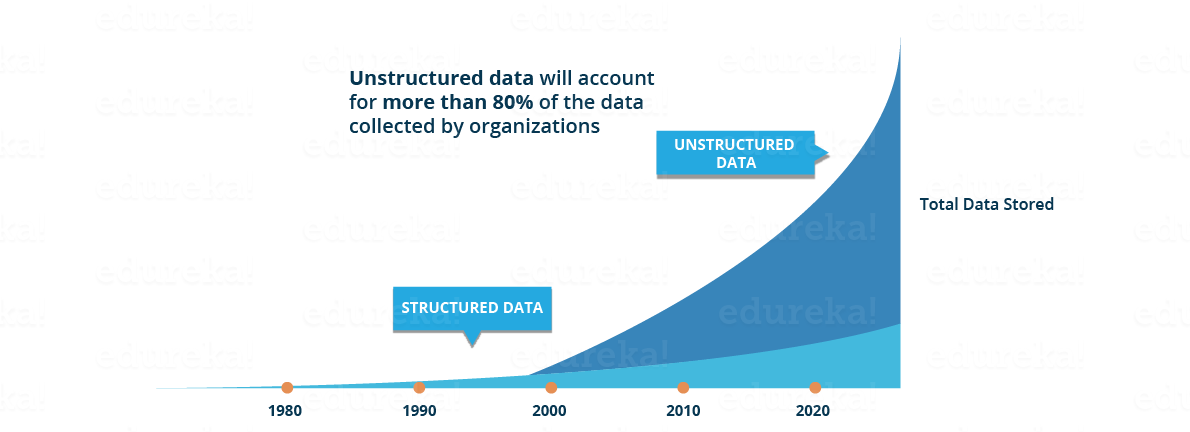
This data is generated from different sources like financial logs, text files, multimedia forms, sensing units, as well as tools. Simple BI tools are not efficient in refining this substantial volume and range of data. This is why we require more complex and advanced analytical tools and algorithms for processing, evaluating, and drawing significant insights from it.
This is not the only reason that Data Science has become so prominent. Now let’s dig much deeper and see exactly how Data Science is being utilized in different domains.
- How about if you can recognize the precise requirements of your clients from the existing data like the client’s previous browsing history, purchase history, age, and revenue. No question you had all these details earlier as well, but now with the substantial amount and variety of data, you can train models better and recommend the product to your consumers with even more precision. Wouldn’t it be amazing as it will bring more business to your organization?
- Let’s take a different circumstance to understand the job role of Data Scientist in decision making. How about if your car had the intelligence to drive you to your residence? The self-driving vehicles accumulate live data from sensing units, consisting of radars, electronic cameras, and lasers to create a map of its environment. Based upon this data, it makes decisions like when to accelerate, when to speed up down, when to overtake, where to take a turn– using innovative machine learning algorithms.
- Let’s see how data can be used in predictive analytics. Let’s take an example of weather forecasting. Data from ships, aircraft, radars, satellites can be gathered and examined to build models. These models will not only predict the weather but also aid in forecasting the occurrence of any type of natural calamities. It will help you to take appropriate steps beforehand and save lives.
Let’s look at the below infographic to see all the domains where Data Science is developing its impression.

Who is a Data Scientist?
There are numerous definitions for Data Scientists. In simple words, a Data Scientist is one who practices the art of Data Science. The term “Data Scientist” has been coined after considering that the Data Scientist draws a lot of information from the scientific field and applications whether it is statistics or mathematics.
What does a Data Scientist do?
Data scientists are those who solve complex data problems with their strong expertise in specific scientific fields. They work with several elements related to maths, statistics, computer technology, etc (though they may not be a specialist in all these fields). They use a lot of current innovations in finding solutions and reaching conclusions that are essential for an organization’s growth and development. Data Scientists provide the information in a useful manner contrary to the raw data available to them from a structured and unstructured manner.
Moving on, let’s learn about BI. I am sure you may have heard of Business Intelligence (BI) as well. Commonly Data Science is confused with BI. I will mention some short and clear differences between both which will aid you in better understanding both the roles. Let’s have a look.
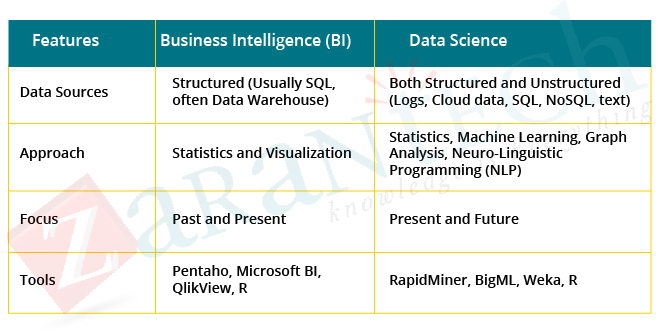
Business Intelligence (BI) vs. Data Science
- BI examines the previous data to find hindsight and insights to describe business trends. BI enables you to take data from external and internal sources, prepare it, run queries on it, and create dashboards to address questions like quarterly income evaluation or business issues. BI can review the impact of specific events shortly.
- Data Science is more of a forward-looking approach, an exploratory method with the focus on examining the past or current data and anticipating the future results to make informed choices. It answers the open-ended concerns as to “what” and also “how” events happen.
Now let’s look at some contrasting attributes.
This was all about what is Data Science, now let us understand the lifecycle of Data Science.
A common error made in Data Science tasks is rushing into data collection and analysis, without comprehending the requirements or perhaps framing the business problem appropriately. Therefore it is very important to follow all the phases throughout the lifecycle of Data Science to make certain the smooth functioning of the task.
The life cycle of Data Science
Below is a quick overview of the important stages of the Data Science Lifecycle:
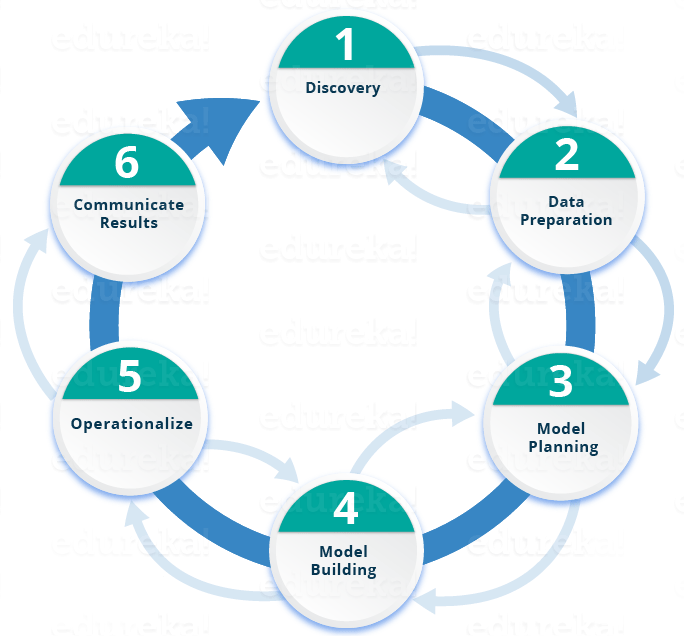
Phase 1– Exploration:
Before you start the job, it is essential to understand the different specifications, requirements, issues, and required budget. You must have the ability to ask the right questions. Here, you can assess if you have the required resources present in regards to people, innovation, time, and information to support the job. In this phase, you also require to mount business issues and develop Initial Hypothesis (IH) to evaluate.
Phase 2– Data prep work:

In this stage, you need an analytical sandbox in which you can execute analytics for the entire project duration. You need to discover, preprocess, and condition data before modeling. Better, you will do ETL (extract, transform, load) to get data into the sandbox. Let’s take a look at the Analytical Analysis flow below.

You can use R for data cleaning, transformation, and visualization. This will assist you to identify the outliers and establish a partnership between the variables. Once you have cleaned and prepared the data, it’s time to do exploratory analytics on it.
Phase 3— Model planning:

Here, you will figure out the techniques and methods to draw the connections between variables. These relationships will set the base for the algorithms which you will carry out with the following stage. You will use Exploratory Data Analytics (EDA) using numerous statistical formulas and data visualization tools.
Let’s have a look at different design planning tools.

- R has a complete collection of modeling abilities and provides a good environment for constructing interpretive versions.
- SQL Analysis solutions can perform in-data analytics using standard data mining features and basic predictive models.
- SAS/ACCESS can be used to access data from Hadoop and also is used for creating repeatable and reusable version flow diagrams.
Although, lots of tools are present out there yet R is one of the most frequently utilized tools.
Now that you have a fair understanding of the nature of your data and have made a decision about the algorithms to be made use of. In the following phase, you will apply the formula and accumulate a model.
Phase 4– Model building:

In this phase, you will establish datasets for training and screening purposes. You will take into consideration whether your existing tools will be adequate for running the models or it will need a more robust environment (like quick and parallel processing). You will examine numerous learning methods like category, association, and clustering to build the model.
Phase 5– Operationalize:

In this phase, you deliver final records, briefings, code, and technical documents. On top of that, in some cases, a pilot project is also implemented in a real-time production setting. This will offer you a clear picture of the efficiency and other relevant restraints on a small scale before complete implementation.
Phase 6 — Communicate results:
Currently, it is necessary to examine if you have been able to achieve the goal that you had prepared in the initial stage. So, in the last phase, you recognize all the crucial findings, communicate to the stakeholders and determine if the results of the task are a success or a failure based on the standards developed in Phase 1.
Currently, I will take a case study to discuss the numerous stages described above.
Case Study: Diabetes Prevention
Suppose we could predict the occurrence of diabetes and take appropriate steps beforehand to stop it?
In this use case, we will forecast the occurrence of diabetes using the entire lifecycle that we discussed previously. Let’s go through various steps.
Step 1:
First, we will gather the information based on the case history of the patient as talked about in Stage 1. You can describe the example data below.
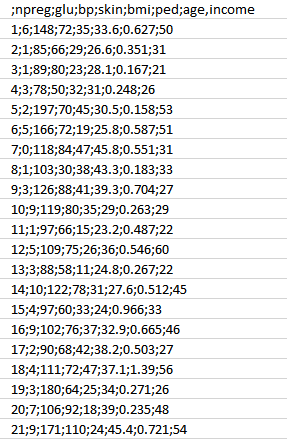
As you can see, we have different attributes as pointed out below.
Attributes:
- npreg– Number of times expecting.
- sugar– Plasma glucose concentration.
- bp– Blood pressure.
- skin– Triceps skinfold density.
- bmi– Body mass index.
- ped– Diabetes pedigree function.
- age– Age.
- revenue– Revenue.
Step 2:
Now, once we have the data, we need to clean and prepare the data for data evaluation.
This data has a lot of inconsistencies like missing values, empty columns, abrupt values, and inaccurate data style which require to be cleaned up.
Here, we have arranged the data into a single table under different features– making it look extra organized.
Let’s take a look at the sample data listed below.
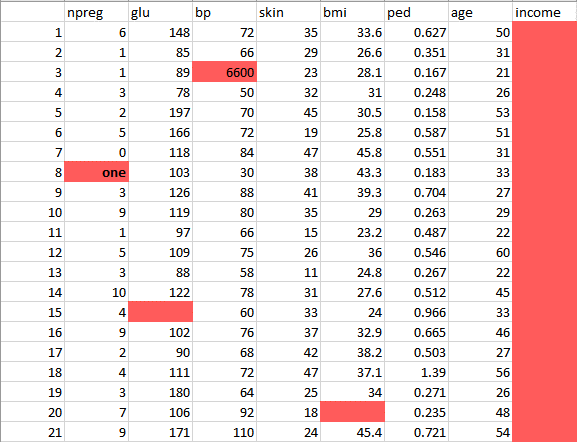
This data has many inconsistencies.
- In the column npreg, “one” is written in words, whereas it should be in the numeric form like 1.
- In column bp one of the values is 6600 which is impossible (at least for humans) as bp cannot go up to such a huge value.
- As you can see the Income column is blank and also makes no sense in predicting diabetes. Therefore, it is redundant to have it here and should be removed from the table.
- So, we will clean and preprocess this data by removing the outliers, filling up the null values and normalizing the data type. If you remember, this is our second phase which is data preprocessing.
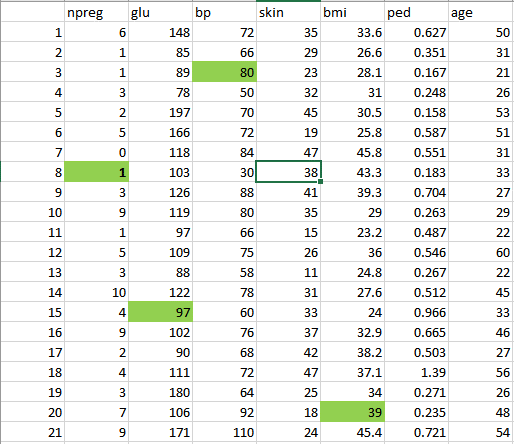
- Finally, we get the clean data as shown below which can be used for analysis.
Step 3:
First, let’s do some evaluation as discussed in Phase 3.
Initially, we will load all the data into the logical sandbox and apply different statistical functions on it. For instance, R has functions like describe which offers us the number of missing out values and unique values. We can also use the summary feature which will provide us analytical details like mean, average, range, min and max values.
Then, we utilize visualization strategies like pie charts, line charts, box plots to get a fair understanding of the distribution of information.

Step 4:
Now, based on insights derived from the previous action, the best fit for this kind of issue is the choice tree. Let’s see how?
Since, we have the major qualities for analysis like npreg, BMI, and so on, we use supervised learning to build a model here.
Further, we have specially made use of the decision tree because it considers all characteristics in one go, like the ones which have a linear relationship along with those which have a non-linear relationship. In our case, we have a linear relationship between npreg and age, whereas the non-linear partnership between npreg and ped.
Decision tree models are also very effective as we can use the various combinations of attributes to make various trees and then finally apply the one with the optimum effectiveness.
Let’s have a look at our decision tree.
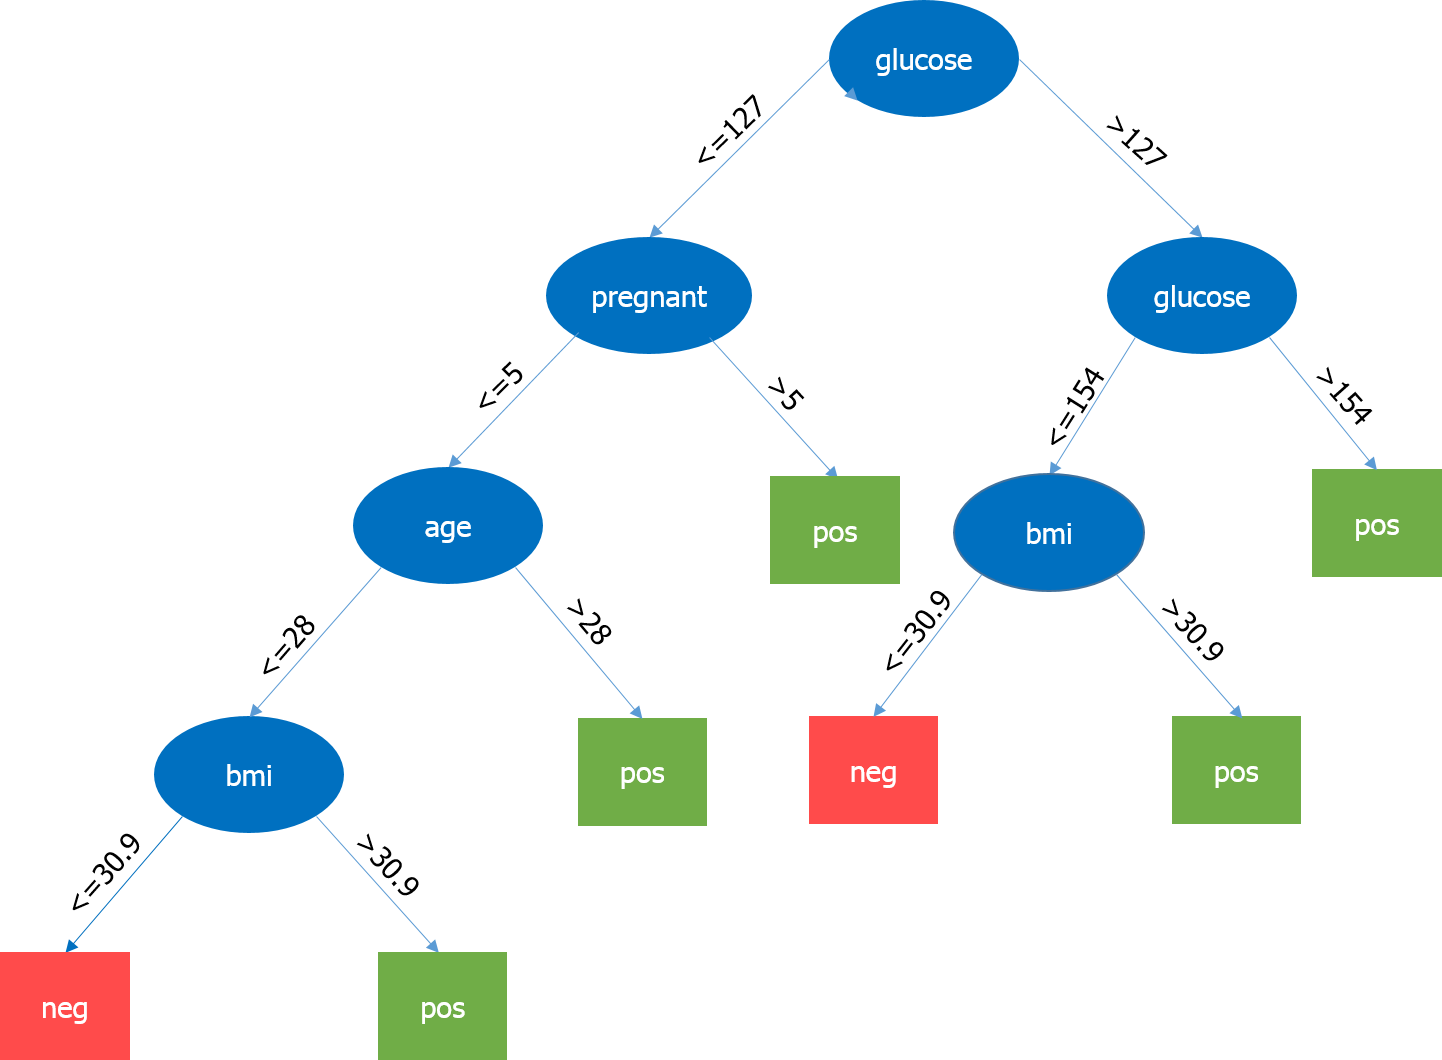
Here, one of the most important specifications is the level of glucose, so it is our root node. Now, the present node and its value determine the next crucial parameter to be taken. It goes on up until we get the results in terms of pos or neg. Pos implies the possibility of having diabetes so positive and negative suggests the possibility of having diabetes is negative.
Step 5:
In this phase, we will run a tiny pilot project to check if our results are appropriate. We will also look for performance restraints if any. If the results are not appropriate, then we need to replan and reconstruct the model.
Step 6:
When we have carried out the project effectively, we will share the output for complete deployment.
Being a Data Scientist is easier said than done. So, let’s see what you need to be a Data Scientist. A Data Scientist calls for skills basically from three significant areas as shown below.
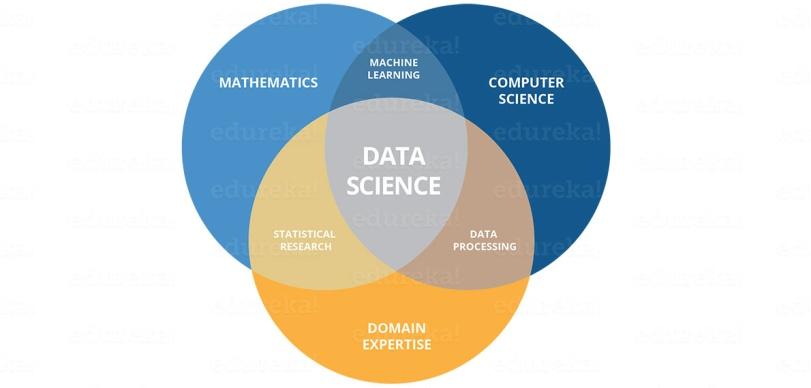
As you can see in the above picture, you need to get various difficult skills both hard and soft skills. You need to be good at stats and maths to analyze and visualize data. Machine Learning creates the heart of Data Science and you need to be good at it. Likewise, you require to have a solid understanding of the domain you are operating in to understand business problems. Your job does not finish here. You should be capable of implementing various algorithms which require good coding skills. Ultimately, as soon as you have made some crucial decisions, you need to provide them to the stakeholders. So, good communication will add brownie points to your skills.
Bottom line
Ultimately, it won’t be wrong to state that the future comes from the Data Scientist. It is expected that there will be a need of around one million Data Scientists by the end of the year. More and more data will offer opportunities to drive vital business choices. It is quickly going to change the way we look at the world deluged with data around us. Consequently, a Data Scientist needs to be extremely experienced and motivated to address one of the most complicated troubles.
l hope you took pleasure in reading the blog and understood what Data Science is. You can also take a look at our online Data Science training here, that includes instructor-led self-paced and real-life project experience. You can also visit the ZaranTech website for more such informative and engaging blog posts.


 99999999 (Toll Free)
  +91 9999999