SAP Analytics Cloud for Newbies
Category: SAP Analytics Cloud Posted:Aug 21, 2020 By: Ashley Morrison
Why is SAP Analytics Cloud so important? What can you finish with it?
I believe that the most crucial aspect about SAP Analytics Cloud is that it brings a simple, powerful and quick-value-delivery tool for analyzing your data.
It is easy to access, feed the data and play with the information to have appealing visual reports and insights on your information.
I see it as a powerful tool for Functional Consultants to bring analytics to their portfolio.
Of course that intricate planning, analytics frameworks will require Analytics Consultants, BW Professionals, BPC analysts. But when it is required to present data aesthetically and perform data .analysis with medium or reduced complexity it is a fantastic tool.
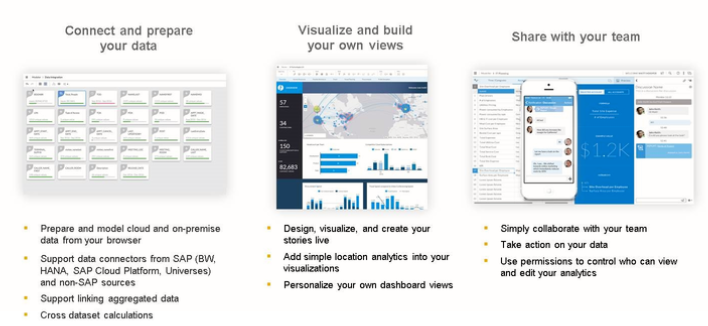
- Bring data from numerous sources.
- You can develop vibrant visual stories for various areas of service.
- Get instant insights into your data.
- Play with the information to create various scenarios.
- Collaborate with your group: Send the visualizations, inquire to do something about it on information, obtain comments.
Some quick use cases that come on top of my head:
I have experience in Cash Management and Treasury. I believe that users would be thinking about obtaining various visuals on Cash Setting and draw insights from it. Regardless Of S/4HANA Cash Management having graphic capacities in FIORI applications, you can bring better insights or analysis on the table.
If I think of Accounts Receivables, I can create cool control panels to assess information from various customers, geo-maps to see the receivable efficiency in different nations, sending reports to the supervisor with collaboration features.
From an AP perspective, I could prepare analysis reports looking at different dimensions and obtaining insights from different perspectives.
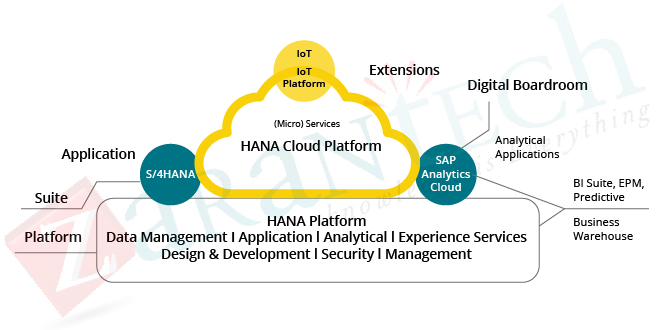
What is SAP Analytics Cloud?
SAP Analytics Cloud is a disruptive could solution that allows you to do the planning, predictive analytics, and business intelligence in a simple and intuitive solution.
It is a Software as a Service (SaaS), built on SAP Cloud System and has the following abilities:
- Analytics for Cloud and On-Premise applications without data duplication
- Make use of data from SAP HANA for Analysis
- Smart exploration and clever analysis capacities
- Data modeling
- Connectivity
It can be hosted on private or Public Cloud. It prepares to integrate conveniently with S/4HANA and HANA.
SAP Analytics Cloud is becoming the key Data Discover tool for SAP. SAP Lumira will remain to be sustained but the majority of the development focus will be in CAVITY.

What kind of data and how can you feed into SAP Analytics Cloud?
Live data source, coming from an On-Premise data source (SAP HANA, SAP S/4HANA, SAP BW). Not all SAP options have a live link (like Success Factors, Fieldglass, etc.).
Replicated Data(or additionally called Gotten Information), for instance from Excel. Google BigQuery, OData, SAP Fieldglass, SAP Concur, and so on
. Excel, CVS documents.
There are sections below with a fast summary of integration with SAP BPC, SAP BW and SAP S/4HANA.
Also, SAP Analytics Hub permits you to bring information from your different on-premise and cloud systems and centralize them in a solitary front-end platform (we will go deeper on this in a future blog).
Data Models in SAP Analytics Cloud
Data Designing is the process of establishing, linking, preparing, and lastly modeling the data. Depending upon what you wish to do, you can create:
- Analysis Model: Uses the information only in read-mode. You can upload information from a succeed, get it from different sources.
- Planning Model: The primary distinction in Planning Model, is that you can create, input, and edit information within the application. It is pre-configured with dimensions for time and categories.
See the options you have to create your model:

Data Analysis and Visualization with SAP Analytics Cloud
Customer experience and visualization are one of the great functions of SAP Analytics Cloud. In the following points, we will see an overview of key aspects.
Stories: A Story in SAP Analytics Cloud is a collection of charts, texts, pictures, tables used to generate a nice style presentation for a specific target audience. With the same data, you might create different stories. For instance, with data from Sales and Account Receivables, individuals from Treasury may be interested in DSO, and Sales Management on the Sales per area.
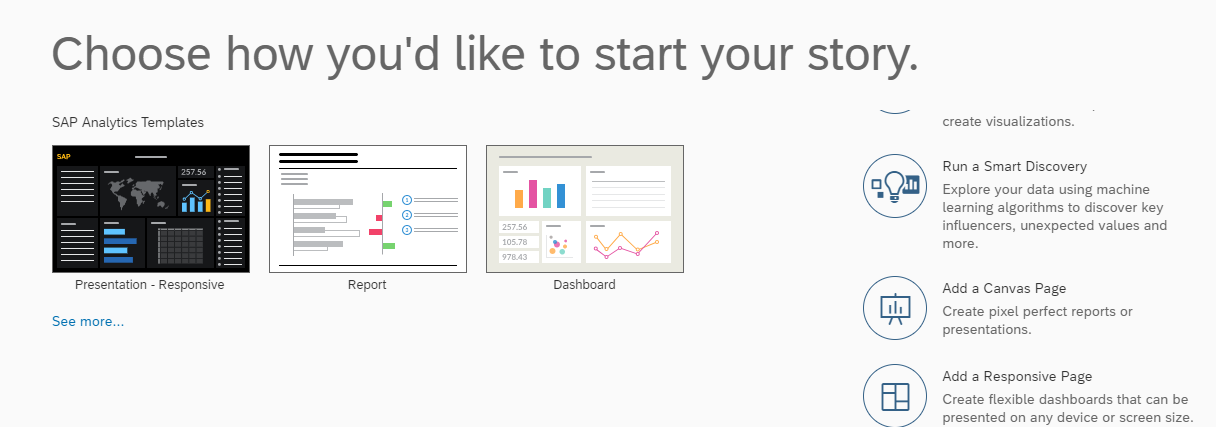
To develop a Story, you do it from Home Page à Create à Story. and you will discover the following options:
- Access and Explore Data: You can add data from a file, live connection, or various other sources to analyze the data and develop different visuals.
- Add a Grid Web page: You can add data from one or more models and show the details with a similar excel sheet
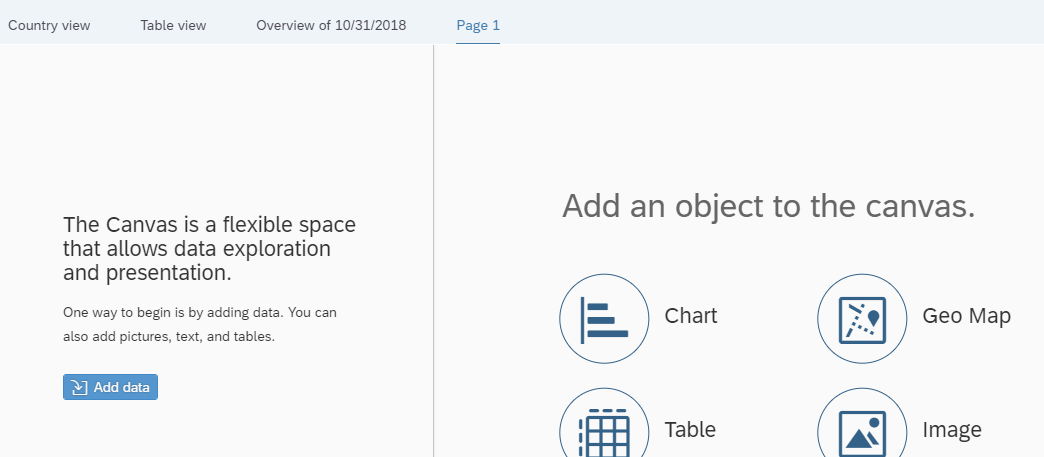
- Add a Canvas Web page: You can add a Canvas to your story, to show info with a better aesthetic version.
- Add a Receptive Page: You can create a responsive page for mobile phones. The same version or information will be arranged for the smartphone screen.
Within a Canvas Page, you can:

- Include Chats, Images, Visualizations.
- Geo Maps: You can create Geo Maps to assess geographical information, helped by the geospatial capacities of HANA.
Some amazing attributes that you can locate when operating in your Story:
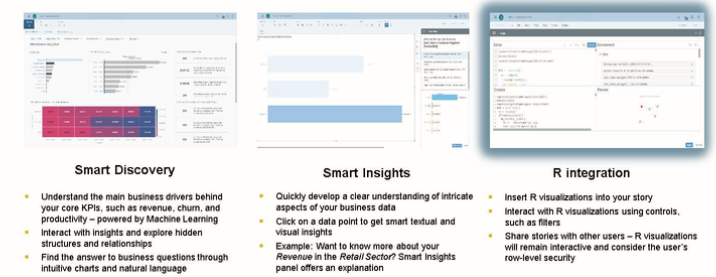
- Smart Discovery: By selecting Smart Discovery in the story, it will show some analysis in the info of your model, like Ordinary, the largest factor, etc

- Smart Discovery: It is a predictive analytics tool that helps you to find a different perspective on the data or connections. It will also open a new web page with new charts and graphics autogenerated.
- R Visualization: R is an open-source programming language and environment for statistical computing and graphics. R provides a wide variety of statistical (linear as well as nonlinear modeling, classical analytical examinations, time-series evaluation, category, clustering, …) and graphical strategies, and is highly extensible. It incorporates SAP Analytics Cloud to create visualizations based on R scripts.
Planning
SAP Analytics Cloud is establishing a new standard for Financial Preparation & evaluation by integrating business intelligence and planning, with each other in the cloud.
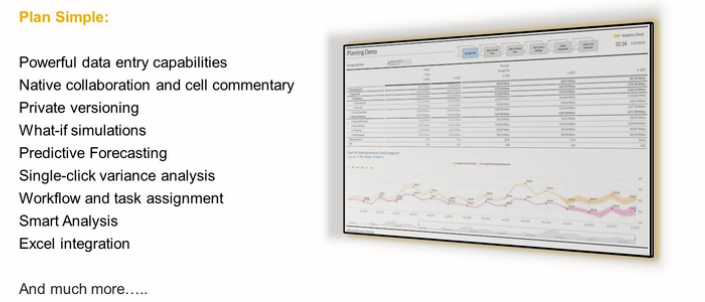
Several features are offered in SAP Analytics Cloud, to execute planning tasks. The core features for intending capabilities are the following ones:
- Version Management: You can create various versions for the strategies and keep various groups, like Budget plan and Actuals.
- Information Access: Imagine you have a strategy with numbers, and you want to customize it by boosting sales volume or rates, to play with different circumstances. You can get data manually in a table, copy/paste, spread values.
- Structure Allocations: You can use structured allocations to establish a reusable procedure for assigning values. CAVITY streamlines the procedure of structure complicated allocations.
- Currency: You can show data in various currencies and modify FX rates on the fly.
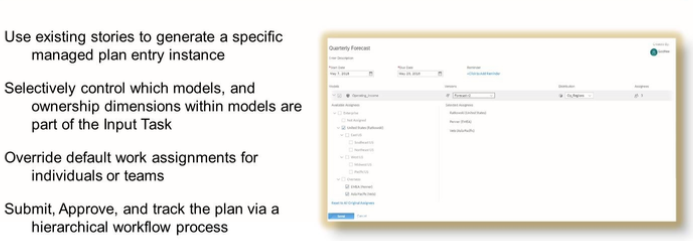
- Input Tasks: You can designate a Story Page to users who are in charge of a dimension, for instance, Sales, and ask them to enter the data directly.
- Integration with SAP Analysis for MS Workplace: Evaluation for the workplace has not only the ability to take in data from SAP Analytics Cloud but contribute directly to SAP Analytics Cloud.
- Value Driver Tree (VDT): Permits you to have fun with different models and show the end to the result for the different scenarios.
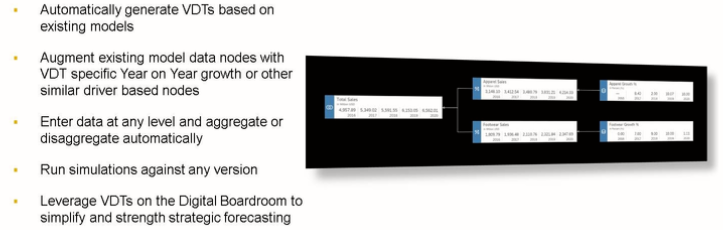
To use planning attributes, you need to deal with planning models and have the appropriate authorizations.
To start an easy plan, you can begin with an empty version, adding dimensions manually or selecting existing measurements. The blank planning model consists of Actual, Budget, Planning and Forecast as predefined classifications.
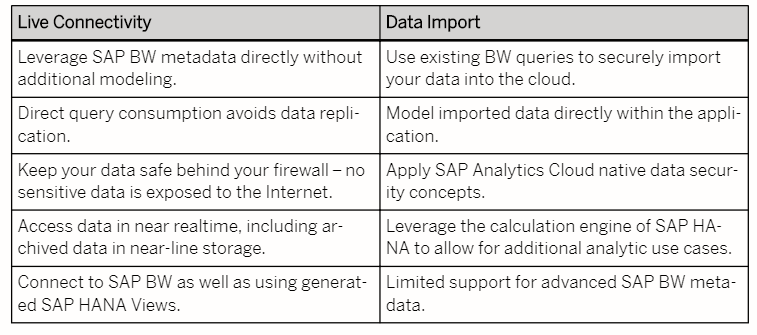
Integration with SAP BW
SAP Analytics Cloud integrates with SAP BW without any replication. The benefit is that you can use your existing data versions in BW to create sights in SAP Analytics Cloud.

Let’s look at the following comparisons for connection alternatives:
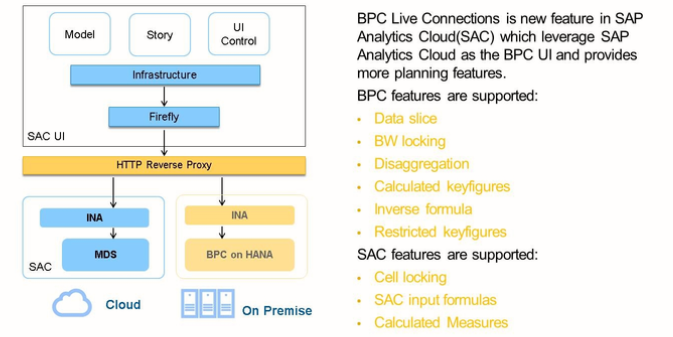
SAP Analytics Cloud and BPC
SAC and BPC have bi-directional integration. SAP Analytics Cloud is not a success for BPC yet a complementary tool. For instance, a business makes use of BPC as it’s primary planning model yet intends to use a Cloud planning application for an additional line of work.

You can do:
- Batch integration: Makes more use of CAVITY calculation engine.
- Near Real-time integration: Makes more use BPC calculation engine.
As an example:
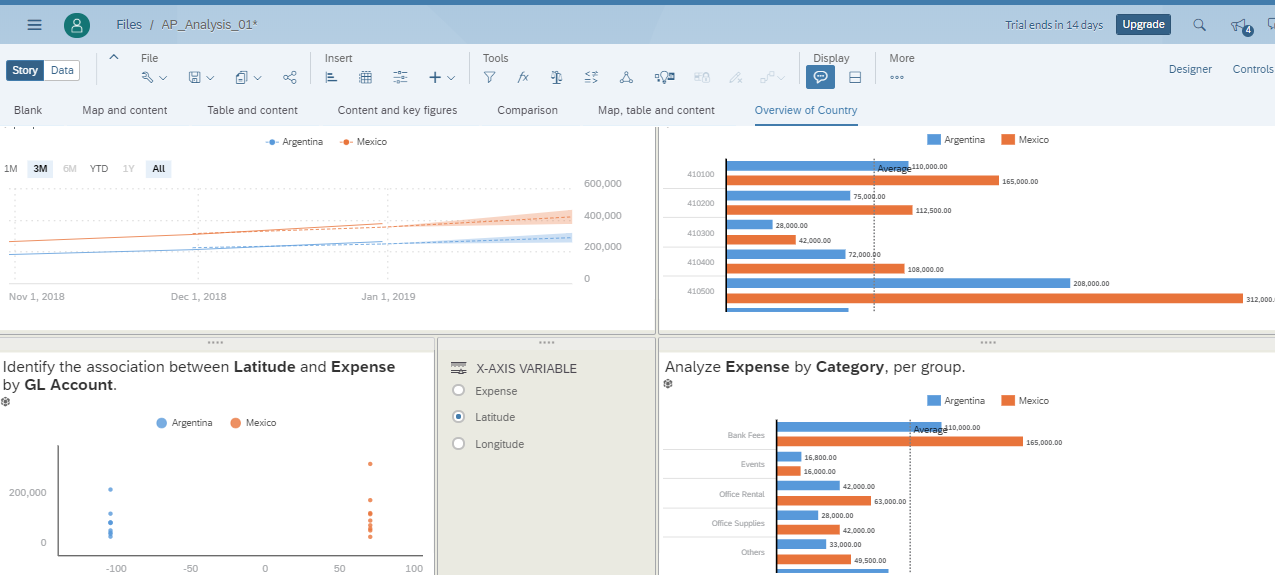
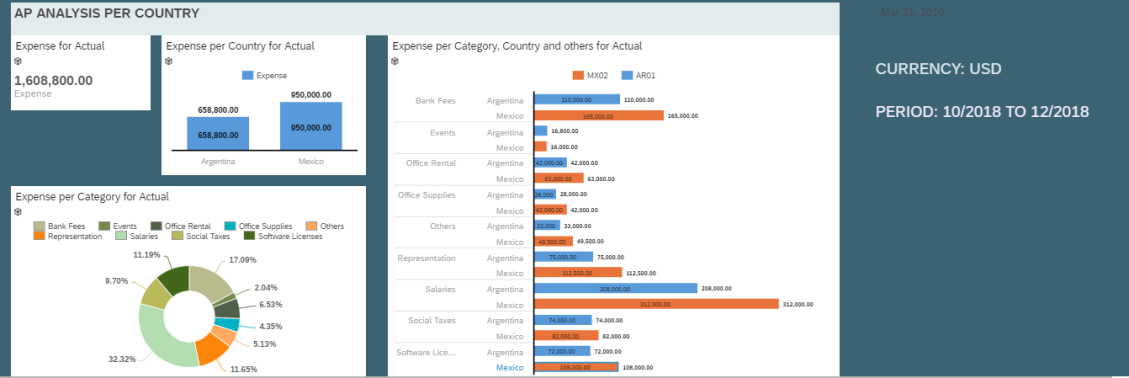
1. I quickly placed Excel with some crucial data.
2. Uploaded to SAP Analytics Cloud and developed a model with AP data:
- Business Code.
- Nation.
- Category of cost.
- Balance to particular dates.
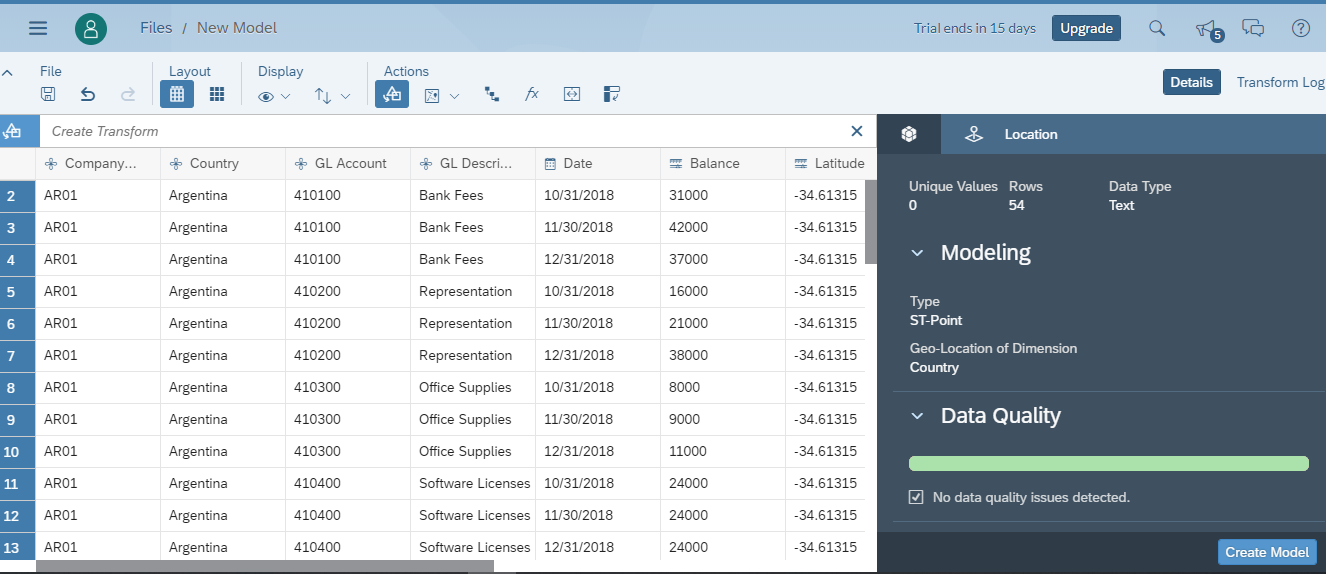
3. Choose an existing layout.
4. After editing and enhancing some facets, I obtained a visual dashboard far better than simply a table.
Bottom line
We’ve reached the dn of the blog and now, if you’re willing to learn from the best, then you’re in the right place. At ZaranTech, we offer self-paced online training SAP Analytics Cloud conducted by experienced industry experts. Browse through our course page for details.
Also, if you’re looking for more such engaging and informative blog posts, feel free to visit our website.
 99999999 (Toll Free)
  +91 9999999